Configuring an NFS (Network File System) server on a Linux system

Configuring an NFS (Network File System) server on a Linux system involves setting up the server, exporting directories to be shared, and configuring access control. Here’s a step-by-step guide on how to configure an NFS server:

  1. Install NFS Server Software:The NFS server software varies by distribution. On most Linux distributions, you can use nfs-kernel-server or nfs-server as the package name. Use your package manager to install it:For Debian/Ubuntu-based systems:sudo apt-get update sudo apt-get install nfs-kernel-server For Red Hat/CentOS-based systems:bashCopy codesudo yum install nfs-utils
  2. Create or Select a Directory to Share:Choose the directory that you want to export over NFS. This directory could be an existing directory or a new one. In this example, we’ll use /srv/nfs_share.sudo mkdir -p /srv/nfs_share
  3. Edit the NFS Exports Configuration:Open the /etc/exports file in your text editor to define the directories you want to share. You can specify IP addresses, hostnames, or subnets that are allowed to access the shared directories.sudo nano /etc/exports Add an entry for the directory you want to share. For example:/srv/nfs_share 192.168.1.0/24(rw,sync,no_root_squash)
    • /srv/nfs_share: The directory to be shared.192.168.1.0/24: The IP address range or specific IP addresses allowed to access the share.rw: Allows read and write access.sync: Data is written to the server’s disk before it is acknowledged.no_root_squash: Allows the root user on the client to have root-level access.
    Adjust the options according to your needs.
  4. Reload NFS Configuration:After editing the /etc/exports file, you need to update the NFS server configuration:sudo exportfs -ra
  5. Start and Enable the NFS Server:Start the NFS server and enable it to start at boot:For systemd-based systems (e.g., Ubuntu 16.04 and later):sudo systemctl start nfs-kernel-server sudo systemctl enable nfs-kernel-server For sysvinit-based systems (e.g., CentOS 6):sudo service nfs start sudo chkconfig nfs on
  6. Configure Firewall (if necessary):If you have a firewall enabled, ensure that it allows NFS traffic. The NFS service uses port 2049 for TCP and UDP, among others. The exact configuration may vary based on your firewall software.
  7. Test the NFS Share:On a client system, you can mount the NFS share to verify that it’s accessible. Replace NFS_SERVER_IP with the IP address or hostname of your NFS server:sudo mount -t nfs NFS_SERVER_IP:/srv/nfs_share /mnt/nfs_mount You can then navigate to /mnt/nfs_mount on the client to access the shared files.

Your NFS server is now set up and configured to share the specified directory. Remember to adjust the export options, access control, and firewall settings according to your security and sharing requirements.

Linux: Tools that is replacing nslookup

nslookup has been a traditional command-line tool for querying Domain Name System (DNS) servers to look up DNS information, such as IP addresses associated with domain names. While nslookup is still available and functional, it has largely been replaced by dig and nslookup itself is considered deprecated on some systems. Let’s discuss the newer tool that’s often recommended for DNS queries:

dig (Domain Information Groper): dig is a powerful and flexible command-line tool for querying DNS servers. It provides more detailed and structured information than nslookup. Here are some key features of dig:

  1. Rich Output Format: dig provides detailed information in a well-structured format, making it easier to interpret and analyze the results of DNS queries.
  2. Query Specific Resource Records: With dig, you can specify the type of resource record you want to query, such as A (IPv4 address), AAAA (IPv6 address), MX (mail exchanger), CNAME (canonical name), and many more.
  3. Extended DNS Features: dig supports advanced DNS features like DNSSEC (Domain Name System Security Extensions) and EDNS0 (Extension Mechanisms for DNS). You can use dig to troubleshoot DNS issues related to these features.
  4. Custom DNS Server: You can specify the DNS server you want to query with dig. This can be useful for troubleshooting DNS problems or checking the configuration of a specific DNS server.

Here’s a basic example of how to use dig to look up the IP address associated with a domain name:

dig example.com

This command will provide detailed information about the DNS query, including the IP address of the domain “example.com.”

For more specific queries, you can use dig to request a particular DNS record type. For example, to find the IPv6 address (AAAA record) for a domain:

dig AAAA example.com

dig is a versatile tool for DNS-related tasks and is the recommended choice for querying DNS information on modern Linux systems. While nslookup is still available on many systems, it’s a good practice to use dig for its enhanced capabilities and more detailed output.

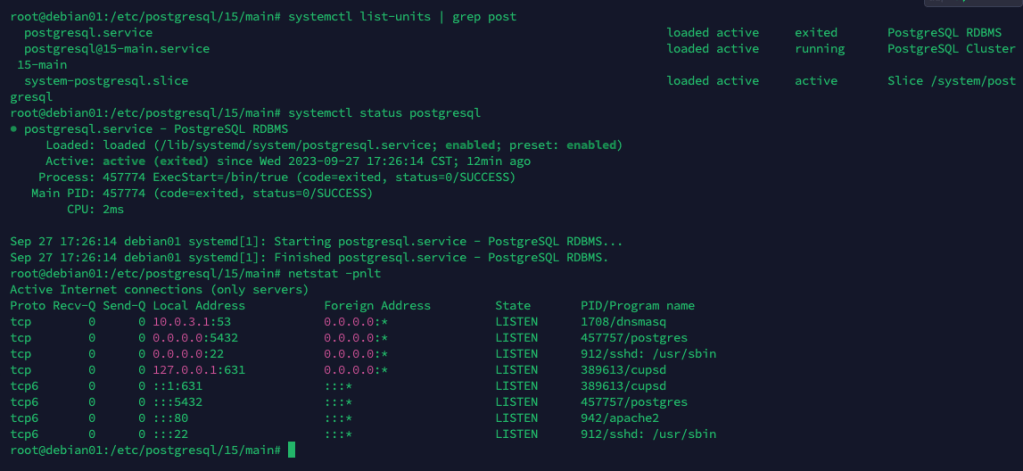
Linux: new tools replacing “netstat”

netstat has long been a useful tool for displaying network-related information on Linux systems. However, it has been deprecated in favor of newer tools like ss and ip, which provide similar network monitoring and management capabilities. These tools are considered more modern and offer better performance. Here are two of the primary tools that replace netstat on Linux:

  1. ss (Socket Statistics):ss is a replacement for netstat and is part of the iproute2 package. It is used to display detailed information about network sockets, interfaces, routing tables, and more. ss provides a more efficient and flexible way to monitor and troubleshoot network connections. Some common ss commands include:
    • Display all listening and non-listening sockets:ss -a
    • List all TCP sockets:ss -t
    • Show UDP sockets:ss -u
    • Display established connections:ss -t -a state established
    • Show listening ports:ss -t -l
  2. ip (iproute2): The ip command is a versatile utility for configuring and managing network interfaces, routes, and more. While it’s not a direct replacement for netstat, it provides more comprehensive control over network configurations. Some ip commands include:
    • Show information about all network interfaces:ip a
    • Display routing table information:bashCopy codeip route
    • Show statistics for a specific interface (e.g., eth0):ip -s link show dev eth0
    • Add or modify network routes:ip route add default via 192.168.1.1

Both ss and ip offer improved performance and more detailed information than netstat. They are commonly available on modern Linux distributions. However, note that they may require superuser (root) privileges or the use of sudo to access some information. You can refer to their respective man pages (man ss and man ip) for detailed usage and command options.

While these tools have largely replaced netstat for modern Linux systems, it’s worth mentioning that some Linux distributions might still include netstat for compatibility reasons. However, using ss and ip is recommended for more up-to-date and accurate network-related information and configurations.

Linux: How to detect new Logical Unit Numbers (LUNs) on a Linux system

To detect new Logical Unit Numbers (LUNs) on a Linux system, you can use several methods depending on your storage configuration, including SCSI, Fibre Channel, or iSCSI. Here are the general steps to detect and configure new LUNs:

  1. Scan for New LUNs:
    • For SCSI Devices (e.g., SAS or SATA): Use the rescan-scsi-bus command to rescan the SCSI bus for new devices. You may need to install the sg3_utils package if it’s not already installed.bashCopy codesudo rescan-scsi-bus
    • For Fibre Channel Devices (FC): You can use the rescan-scsi-bus.sh script, which is often available on Linux systems for rescanning the SCSI bus. Run it with the -a flag to scan all HBAs (Host Bus Adapters) or specify the HBA number.sudo rescan-scsi-bus.sh -a
    • For iSCSI Devices: To detect new iSCSI LUNs, you need to rescan the iSCSI target. This typically involves using the iscsiadm command:sudo iscsiadm -m discovery -t st -p <target_IP_or_hostname> sudo iscsiadm -m node -L all
  2. Check for New Devices:After rescanning the bus or targets, you can check for the new devices that have been detected by examining the /sys/class/scsi_device/ directory. You can list the devices by running:bashCopy codels /sys/class/scsi_device/ Each subdirectory corresponds to a SCSI device.
  3. Rescan Partitions:If the newly detected devices include disk partitions, you should rescan the partitions to make them available. You can do this by running:partprobe
  4. Verify and Mount New LUNs:Once the new LUNs are detected, you should be able to use tools like lsblk, fdisk, or parted to verify the presence of new disks. For example:bashCopy codelsblk fdisk -l If you find new disks, you can create partitions and mount them as needed. Make sure to update your /etc/fstab file to ensure the mounts persist across reboots.
  5. Update Multipathing (if applicable):If you’re using multipathing for redundancy, you may need to update the multipath configuration to include the new LUNs. This typically involves editing the /etc/multipath.conf file and running multipath -v2 to refresh the multipath devices.
  6. Configure and Format:If the new LUNs are blank or need to be reformatted, use tools like mkfs to format them with the desired filesystem (e.g., ext4 or XFS).

Remember that detecting and configuring new LUNs may vary based on your specific storage and Linux distribution. Always consult your storage and system documentation for any distribution-specific steps or tools to use. Additionally, ensure you have backups and take precautions when making changes to storage configurations to prevent data loss.

Linux: Display system logs on systems using “systemd”

On a Linux system that uses systemd for managing services and logs, you can use the journalctl command to display system logs. Systemd’s journal provides a centralized and efficient way to access and analyze log data. Here are some common journalctl commands for viewing system logs:

  1. View the entire journal: To display the entire system log, use the journalctl command without any options:journalctl This will display log entries starting with the most recent.
  2. View logs since a specific time: You can view logs since a specific time by using the -S (since) option:journalctl -S "YYYY-MM-DD HH:MM:SS" Replace “YYYY-MM-DD HH:MM:SS” with the desired timestamp.
  3. View logs for a specific unit (service): To view logs for a specific systemd unit (e.g., a service), use the -u option followed by the unit name:journalctl -u your-service-name
  4. View logs with a specified priority (log level): You can filter logs by priority (log level) using the -p option. For example, to view only messages with priority “error” or higher:bashCopy codejournalctl -p err You can use different log levels, such as “emerg,” “alert,” “crit,” “err,” “warning,” “notice,” “info,” and “debug.”
  5. Display logs as a continuous stream: To view logs in real-time as they are written to the journal, use the -f option:journalctl -f Press Ctrl+C to exit the continuous view.
  6. Display logs from the previous boot: To view logs from the previous boot, you can use the -b option with an offset. For example, to view logs from the last boot:journalctl -b -1 The -1 indicates the previous boot, and you can use -2 for the boot before that, and so on.
  7. Filter logs by a specific process or program: To filter logs by a specific process or program, you can use the -t (tag) option. For example:journalctl -t your-process-name
  8. View logs in a pager (e.g., less): By default, journalctl may display logs using a pager (usually “less”) for easier navigation. You can scroll through logs using arrow keys, and press q to exit.

These are some of the common journalctl commands to display Linux system logs using systemd. The journal provides a powerful and flexible way to access and search for log information on a systemd-managed system.

Linux: Debugging bash scritps

Debugging Bash scripts involves identifying and resolving errors, unexpected behavior, or issues in your script. Here are some techniques and tools you can use to debug Bash scripts effectively:

  1. Use set -x: You can add set -x at the beginning of your script to enable debugging mode. This will display each command and its result as it is executed. For example:#!/bin/bash set -x echo "Hello, World" When you run the script, it will display each line with a “+ ” prefix to show the command and its output.
  2. Use set -e: Adding set -e makes your script exit immediately if any command returns a non-zero exit status. This can help you catch errors early in your script. For example:#!/bin/bash set -e echo "Hello, World" # This will exit the script if the previous command fails
  3. Use echo and read: You can insert echo statements at various points in your script to print variables, intermediate results, or messages. This can help you track the progress of your script and identify where issues may be occurring. You can also use read to pause script execution to inspect variables or the state of your script.
  4. Check variable values: Make sure to echo or print the values of variables to the terminal to verify that they contain the expected data. For example:#!/bin/bash my_variable="Hello, World" echo "my_variable contains: $my_variable"
  5. Use set -u: Enabling set -u will make your script exit if it references an uninitialized variable. This can help catch issues where you expect a variable to be set but it isn’t.
  6. Redirect output to a log file: You can redirect the output of your script to a log file using the > or >> operators. This can be useful for reviewing the script’s output later and identifying any errors. For example:#!/bin/bash ./my_script.sh > debug.log 2>&1
  7. Comment out sections: Temporarily comment out sections of your script to isolate the problematic code. By narrowing down the issue to a specific part of your script, you can focus your debugging efforts more effectively.
  8. Use a text editor or IDE with syntax highlighting: Writing your script in a text editor or integrated development environment (IDE) with Bash syntax highlighting can help you spot syntax errors more easily.
  9. Run your script step by step: If your script is long and complex, consider running it step by step. You can execute individual sections of code to verify their correctness. To do this, you can copy and paste the commands into your terminal or use the source command to execute a script file within the current shell.
  10. Check for error messages: Pay attention to any error messages or warnings generated by the script. They can provide valuable information about what went wrong.

By using these techniques and a systematic approach, you can effectively debug Bash scripts and identify and resolve issues more efficiently.

RedHat Openshift command line

Red Hat OpenShift is a Kubernetes-based container platform for managing and orchestrating containerized applications. To interact with OpenShift from the command line, you can use the OpenShift Command-Line Interface (CLI), commonly known as oc. This tool allows you to perform various operations on your OpenShift cluster. Here are some common oc commands and their usage:

  1. Login to OpenShift Cluster:oc login https://<OpenShift Master URL> You will be prompted to provide your credentials.
  2. Project and Namespace Operations:
    • List all projects (namespaces):codeoc get projects
    • Create a new project (namespace):arduinoCopy codeoc new-project <project-name>
  3. Deploy Applications:
    • Deploy an application from a YAML file:create -f <yaml-file>
    • Deploy an application from a Git repository:arduinoCopy codeoc new-app <Git-repo-URL>
  4. Managing Deployments:
    • View deployments:oc get deployments
    • Scale a deployment:oc scale --replicas=<replica-count> deployment/<deployment-name>
  5. Expose Services:
    • Expose a service to the internet:oc expose service <service-name>
    • List routes (public URLs) for your services:arduinoCopy codeoc get routes
  6. Monitoring and Logging:
    • View cluster-wide metrics (requires the OpenShift Monitoring stack):oc get --raw /apis/custom.metrics.k8s.io/v1beta1
    • Access container logs:oc logs <pod-name>
  7. Security and User Management:
    • Create new users or manage user roles (requires appropriate permissions):sqlCopy codeoc create user <username>
    • Add a user to a project (namespace):oc adm policy add-role-to-user <role> <username> -n <project-name>
  8. Viewing Resources:
    • List pods in a project (namespace):oc get pods -n <project-name>
    • Describe a resource:phpCopy codeoc describe <resource-type> <resource-name>
  9. Accessing the Web Console:Open the OpenShift web console in a web browser by running:oc whoami --show-console
  10. Other Useful Commands:
  • Restart a pod:oc delete pod <pod-name>
  • Delete a resource (e.g., a service or deployment):oc delete <resource-type> <resource-name>

These are just some common oc commands for managing and interacting with an OpenShift cluster. The oc CLI is feature-rich and can perform a wide range of operations for application deployment, scaling, monitoring, and more. You can access the full documentation for oc by running oc --help or oc <command> --help for specific command usage information.

Linux: firewall-cmd command options

firewall-cmd is a command-line utility for managing firewalld, the dynamic firewall manager available on many Linux distributions. It allows you to configure various aspects of your firewall settings. To display the available options for firewall-cmd, you can use the --help option or explore specific subcommands and their options. Here are the general options:

  1. To display the general help and a list of available options for firewall-cmd:firewall-cmd --help
  2. To display the version of firewall-cmd:cssCopy codefirewall-cmd --version
  3. To display help for a specific subcommand, you can use:firewall-cmd --<subcommand> --help Replace <subcommand> with the specific operation you want to learn more about, such as --add-service, --add-port, --list-services, --list-ports, etc.

Here are some common firewall-cmd subcommands and their options:

  • --add-service: Add a service to the firewall configuration.
    • --permanent: Make the change permanent (will survive reboots).

Example:

firewall-cmd --add-service=http firewall-cmd --add-service=http --permanent

  • --add-port: Add a port to the firewall configuration.
    • --permanent: Make the change permanent (will survive reboots).

Example:

firewall-cmd --add-port=80/tcp firewall-cmd --add-port=80/tcp --permanent

  • --remove-service: Remove a service from the firewall configuration.
    • --permanent: Make the change permanent (will survive reboots).

Example:

firewall-cmd --remove-service=http firewall-cmd --remove-service=http --permanent

  • --remove-port: Remove a port from the firewall configuration.
    • --permanent: Make the change permanent (will survive reboots).

Example:

firewall-cmd --remove-port=80/tcp firewall-cmd --remove-port=80/tcp --permanent

  • --list-all: Show all configured rules, including services, ports, and other settings.
    • --permanent: List only the permanent rules.

Example:

firewall-cmd --list-all firewall-cmd --list-all --permanent

  • --reload: Reload the firewall configuration. Useful when you make changes to the configuration.

Example:

firewall-cmd --reload

These are just a few of the many options and subcommands available with firewall-cmd. For detailed information on specific options, you can refer to the firewall-cmd manual page or use the --help option for specific subcommands, as shown earlier.